Shack Weather Beacon
This project began as a small ESP32 build acting as an APRS-IS node (VU35KB-13 on APRS.fi). The same board and shack install later grew into a weather beacon: live temperature, humidity, and pressure from inside the radio shack, with derived metrics calculated in the browser.
Live dashboard: Weather station
Scope: Indoor telemetry at Bangalore (grid MK82uu, about 920 m altitude). Not outdoor weather or a certified forecast. Three sensor fields feed all charts and derived values. No AI.
Hardware
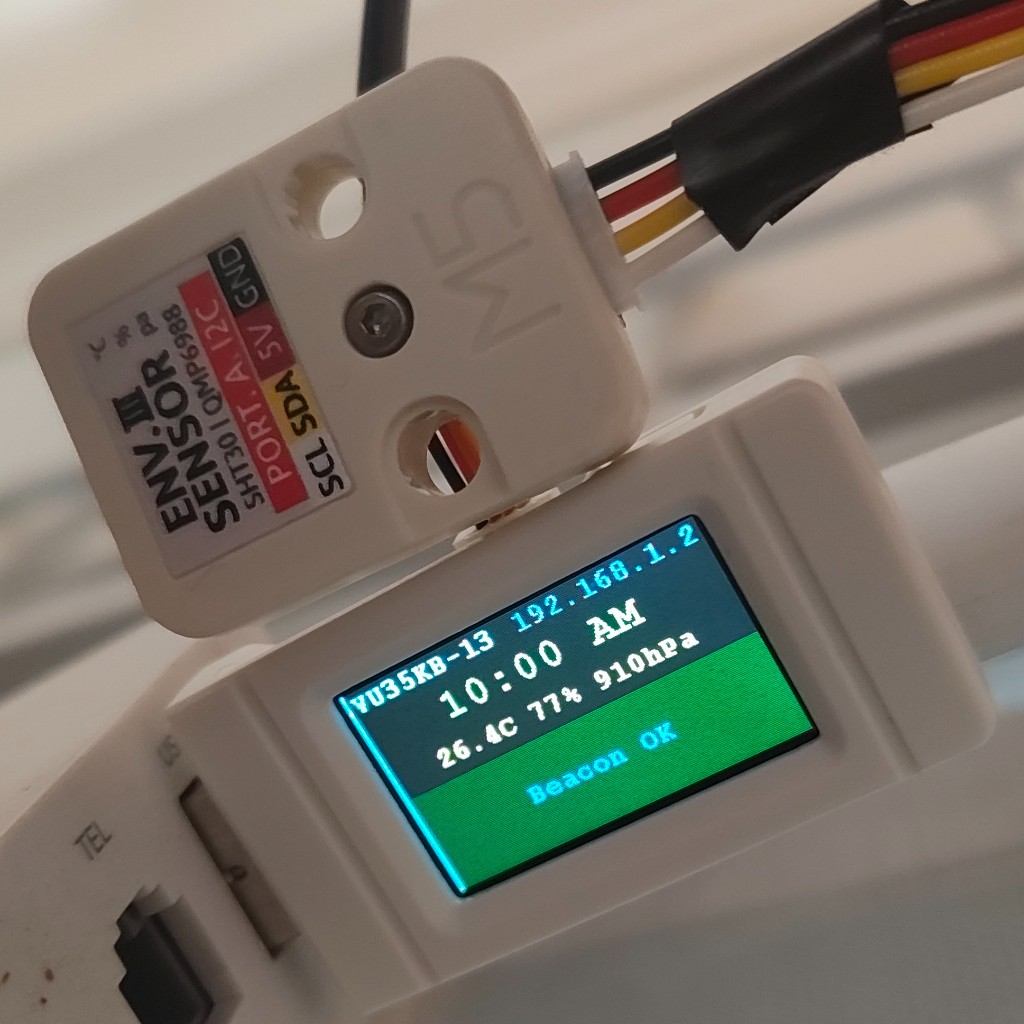
Waveshare ESP32-S3 Geek with M5Stack ENV III. The onboard screen shows temperature, humidity, pressure, and APRS beacon status.
| Component | Role |
|---|---|
| M5Stack ENV III | Environmental sensor module |
| SHT30 (on ENV III) | Temperature and relative humidity |
| QMP6988 (on ENV III) | Barometric pressure |
| ESP32-S3 Geek (Waveshare) | Reads the sensor over local Wi-Fi |
| Placement | Fixed install inside the shack |
The ESP32 still participates in the APRS ecosystem as VU35KB-13. The web dashboard is a separate view built from the same sensor pipeline.
Data pipeline
The weather path is self-hosted on a private VPS. No third-party weather API or cloud IoT platform. The static site (ham.srinikb.in) and n8n workflow run on the same VPS. Formulas run in your browser. APRS-IS and NTP are the only external services in the sensor loop.
- ESP32 samples ENV III every 15 minutes.
- Readings POST to n8n on the VPS. The workflow writes each row to an n8n Data Table (full history kept for your own trend analysis). A JSON API returns the recent window the dashboard needs.
- The dashboard fetches that API in the browser and caches results in memory and
localStorage. Charts and cards show the last 24 hours; older rows remain in the Data Table on the VPS. - Auto-refresh when cache is older than 10 minutes, or when the latest reading is older than 20 minutes. Manual refresh has a 60 second cooldown.
End-to-end flow
                    ┌──────────────────┐
                    │ Boot: config LCD │
                    │ WiFi, NTP, web UI│
                    └────────┬─────────┘
                             │
         (background: config web UI, WiFi retry, LCD refresh 1 s)
                             │
              ┌──────────────┴──────────────┐
              │      Every 15 minutes       │
              └──────────────┬──────────────┘
                             │
                    ┌────────▼─────────┐
                    │ ESP32-S3 Geek    │
                    │ reads ENV III    │
                    │ SHT30 + QMP6988  │
                    └────────┬─────────┘
                             │
                    ┌────────▼─────────┐
                    │ Update LCD       │
                    └────────┬─────────┘
                             │
              ┌──────────────┴──────────────┐
              │      Beacon enabled?        │
              └─────┬──────────────────┬────┘
                 no │                  │ yes
                    │    ┌─────────────▼──────────────┐
                    │    │ APRS-IS (external, opt.)   │
                    │    │ login + WX packet TX       │
                    │    │ rotate.aprs2.net:14580     │
                    │    └─────────────┬──────────────┘
                    │                  │
                    └────────┬─────────┘
                             │
                    ┌────────▼─────────┐
                    │ n8n webhook      │
                    │ HTTPS POST JSON  │
                    └────────┬─────────┘
                             │
              ───── Self-hosted VPS ─────
                             │
                    ┌────────▼─────────┐
                    │ Data Table       │
                    │ full history     │
                    └────────┬─────────┘
                             │
                    ┌────────▼─────────┐
                    │ JSON API         │
                    │ last ~24h rows   │
                    └────────┬─────────┘
                             │
              ┌───────────────┴─────────┐
              │                         │
   ┌──────────▼──────────┐   ┌──────────▼──────────┐
   │ ham.srinikb.in      │   │ Browser fetch API   │
   │ Astro /weather page │   │ dashboard last 24h  │
   │ static site + JS    │   │ cache + formulas    │
   └─────────────────────┘   └─────────────────────┘
Self-hosted on a private VPS. No third-party weather API or cloud IoT. The dashboard shows 24 hours; the n8n Data Table retains full history for later analysis. The static site serves the /weather page; the browser fetches the JSON API directly.
Device detail (protocols and background loop):
| Step | What happens |
|---|---|
| Background | Config web UI at device IP (/, /save, /status). WiFi retry every 10 s. LCD refresh every 1 s. Runs continuously after boot. |
| Boot | Load config from flash. Init ENV III (I2C). Connect WiFi. Web server on port 80. NTP sync (external). First cycle if online. |
| Sensor read | SHT30 temp/RH and QMP6988 pressure over I2C (pins 16/17). |
| LCD | Callsign, IP, local time, env line, APRS status band. |
| APRS (if enabled) | TCP to APRS-IS. Login with callsign passcode. Send position + WX comment (t/h/b fields). Disconnect. |
| Webhook | POST {"temperature","humidity","pressure"} to configured URL. Always runs after each cycle when sensors are valid. |
If beacon is turned off in settings, APRS is skipped but sensor read and webhook POST still run every 15 minutes.
API record shape
| Field | Unit | Description |
|---|---|---|
temperature | °C | Air temperature |
humidity | % | Relative humidity |
pressure | hPa | Station barometric pressure |
createdAt | ISO timestamp | Reading time |
Raw metrics (sensor)
| Metric | Source |
|---|---|
| Temperature | SHT30 |
| Humidity | SHT30 |
| Pressure | QMP6988 at shack altitude |
Derived metrics (calculated)
All formulas run client-side. Display values use 2 decimal places.
Dew point
Magnus formula over liquid water:
α = (17.27 × T) / (237.7 + T) + ln(RH/100)T_dew = (237.7 × α) / (17.27 − α)
T is °C, RH is percent relative humidity.
Use: Moisture in the air. Compare to temperature for condensation risk.
Dew margin
margin = temperature − dewPoint
Use: Gap before saturation. Below about 2 °C margin, condensation on cold metal is more likely.
Saturation vapor pressure
SVP = 0.6108 × exp((17.27 × T) / (T + 237.3)) kPa
Vapor pressure deficit (VPD)
VPD = SVP × (1 − RH/100) kPa
Use: How dry the air is. Higher VPD means stronger evaporative drying.
Feels like
Hybrid apparent temperature:
-
If
Tat or above 26.7 °C (80 °F): Rothfusz heat index (US NWS regression, converted to °C), with low and high humidity adjustments. -
Otherwise: Steadman apparent temperature with wind assumed 0 m/s (no wind sensor):
AT = T + 0.33 × e − 4whereeis vapor pressure in hPa.
Use: Perceived heat and humidity combined.
Sea-level pressure
Barometric reduction to mean sea level using station altitude (920 m for Bangalore):
SLP = P × (1 − (0.0065 × h) / (T_K + 0.0065 × h))^(−5.257)
Use: Compare shack pressure to weather reports and other stations.
Comfort label
Rule-based label from temperature, humidity, and feels-like:
| Condition | Label |
|---|---|
| T under 16 °C | Cool |
| Feels at or above 35 °C | Very Hot |
| Feels at or above 32 °C | Hot & Humid |
| RH at or above 85% | Very Humid |
| T at or above 28 °C | Warm |
| RH at or above 70% | Humid |
| Else | Comfortable |
Trends and aggregates
Chart window
Sliding window ending at the latest reading: 24, 12, 6, or 3 hours. Preference stored in browser localStorage.
Min / avg / max
Simple min, mean, and max over the selected window for each raw metric.
Hourly rate
(value_end − value_start) / hours_elapsed across the window.
Pressure shift
Compares average of the last 3 readings vs the previous 3:
| Delta (hPa) | Label |
|---|---|
| above 0.4 | Rising |
| below -0.4 | Falling |
| otherwise | Stable |
Rain outlook (barometric rules)
Based on 3-hour pressure change plus humidity. Not a numerical weather model.
3-hour pressure delta
At each timestamp, find the reading closest to 3 hours earlier (within 45 minutes tolerance). Delta = current pressure minus pressure 3h ago.
Tendency classes
METAR-style barometric tendency on the 3h delta (hPa):
| Delta (hPa) | Label |
|---|---|
| at or below -3 | Falling rapidly |
| at or below -1.5 | Falling |
| at or below -0.5 | Falling slowly |
| under 0.5 | Steady |
| under 1.5 | Rising slowly |
| under 3 | Rising |
| 3 or more | Rising rapidly |
Rain score
Rule table inspired by standard barometric tendency practice (WMO-style tendency / Lancaster-style short-range rules):
| Tendency | Risk | Score (0-100) | Summary |
|---|---|---|---|
| Rapid fall | high | 85 | Rain or storms likely |
| Fall | moderate | 65 | Rain possible |
| Slow fall | low | 45 | Watch the trend |
| Steady | low | 25 | Fair conditions likely |
| Slow rise | low | 15 | Slowly improving |
| Rise / rapid rise | low | 10 | Clearing trend |
Adjustments:
- Delta below -0.5 hPa and RH at or above 80%: score +15 (cap 95); risk bumped to moderate if it was low.
- Pressure under 1000 hPa and delta below -1 hPa: score +5 (cap 95).
Use: Hint for outdoor rain risk from indoor barometer trend. Confirm with local forecasts before field work.
Solar and time context
Station coordinates: Bangalore (stations.json, grid MK82uu).
Sunrise / sunset: NOAA-style solar position (equation of time, declination, 90.833° zenith for refraction). Used for daylight strip and night bands on charts.
Night shading: Timestamps between sunset and sunrise at the station. Fallback: IST hour bands (night 19:00 to 05:00, dawn 05:00 to 07:00, day 07:00 to 17:00, dusk 17:00 to 19:00).
Display time: 12-hour IST (Asia/Kolkata).
Daily rhythm chart
Groups readings by IST hour (0-23) and averages temperature per hour within the selected window.
Dashboard sections
| Section | Content |
|---|---|
| Live card | Raw values, feels like, dew point, SLP, VPD, comfort, solar strip |
| Rain outlook | Current summary and 3h tendency |
| History chart | Temp / humidity / pressure with hover dock for derived fields |
| Pressure & rain | 3h delta and rain score history |
| Condensation | Temperature vs dew point |
| Daily rhythm | Hourly average temperature (IST) |
| Rates & range | Per-hour rates and min/avg/max |
| Hardware | Sensor and sampling summary |
Humidity chart shows a 40 to 60% RH comfort band.
Limitations
- Indoor air lags and differs from outside weather.
- Rain outlook is a rule-based barometer hint, not a forecast model.
- No wind, rain, or UV sensors; feels-like assumes zero wind.
- 15 minute sampling smooths short spikes.
- Several hours of history needed for 3h pressure delta charts.
Related links
- Live weather dashboard
- VU35KB-13 on APRS.fi
- Station page for solar countdowns and operating context